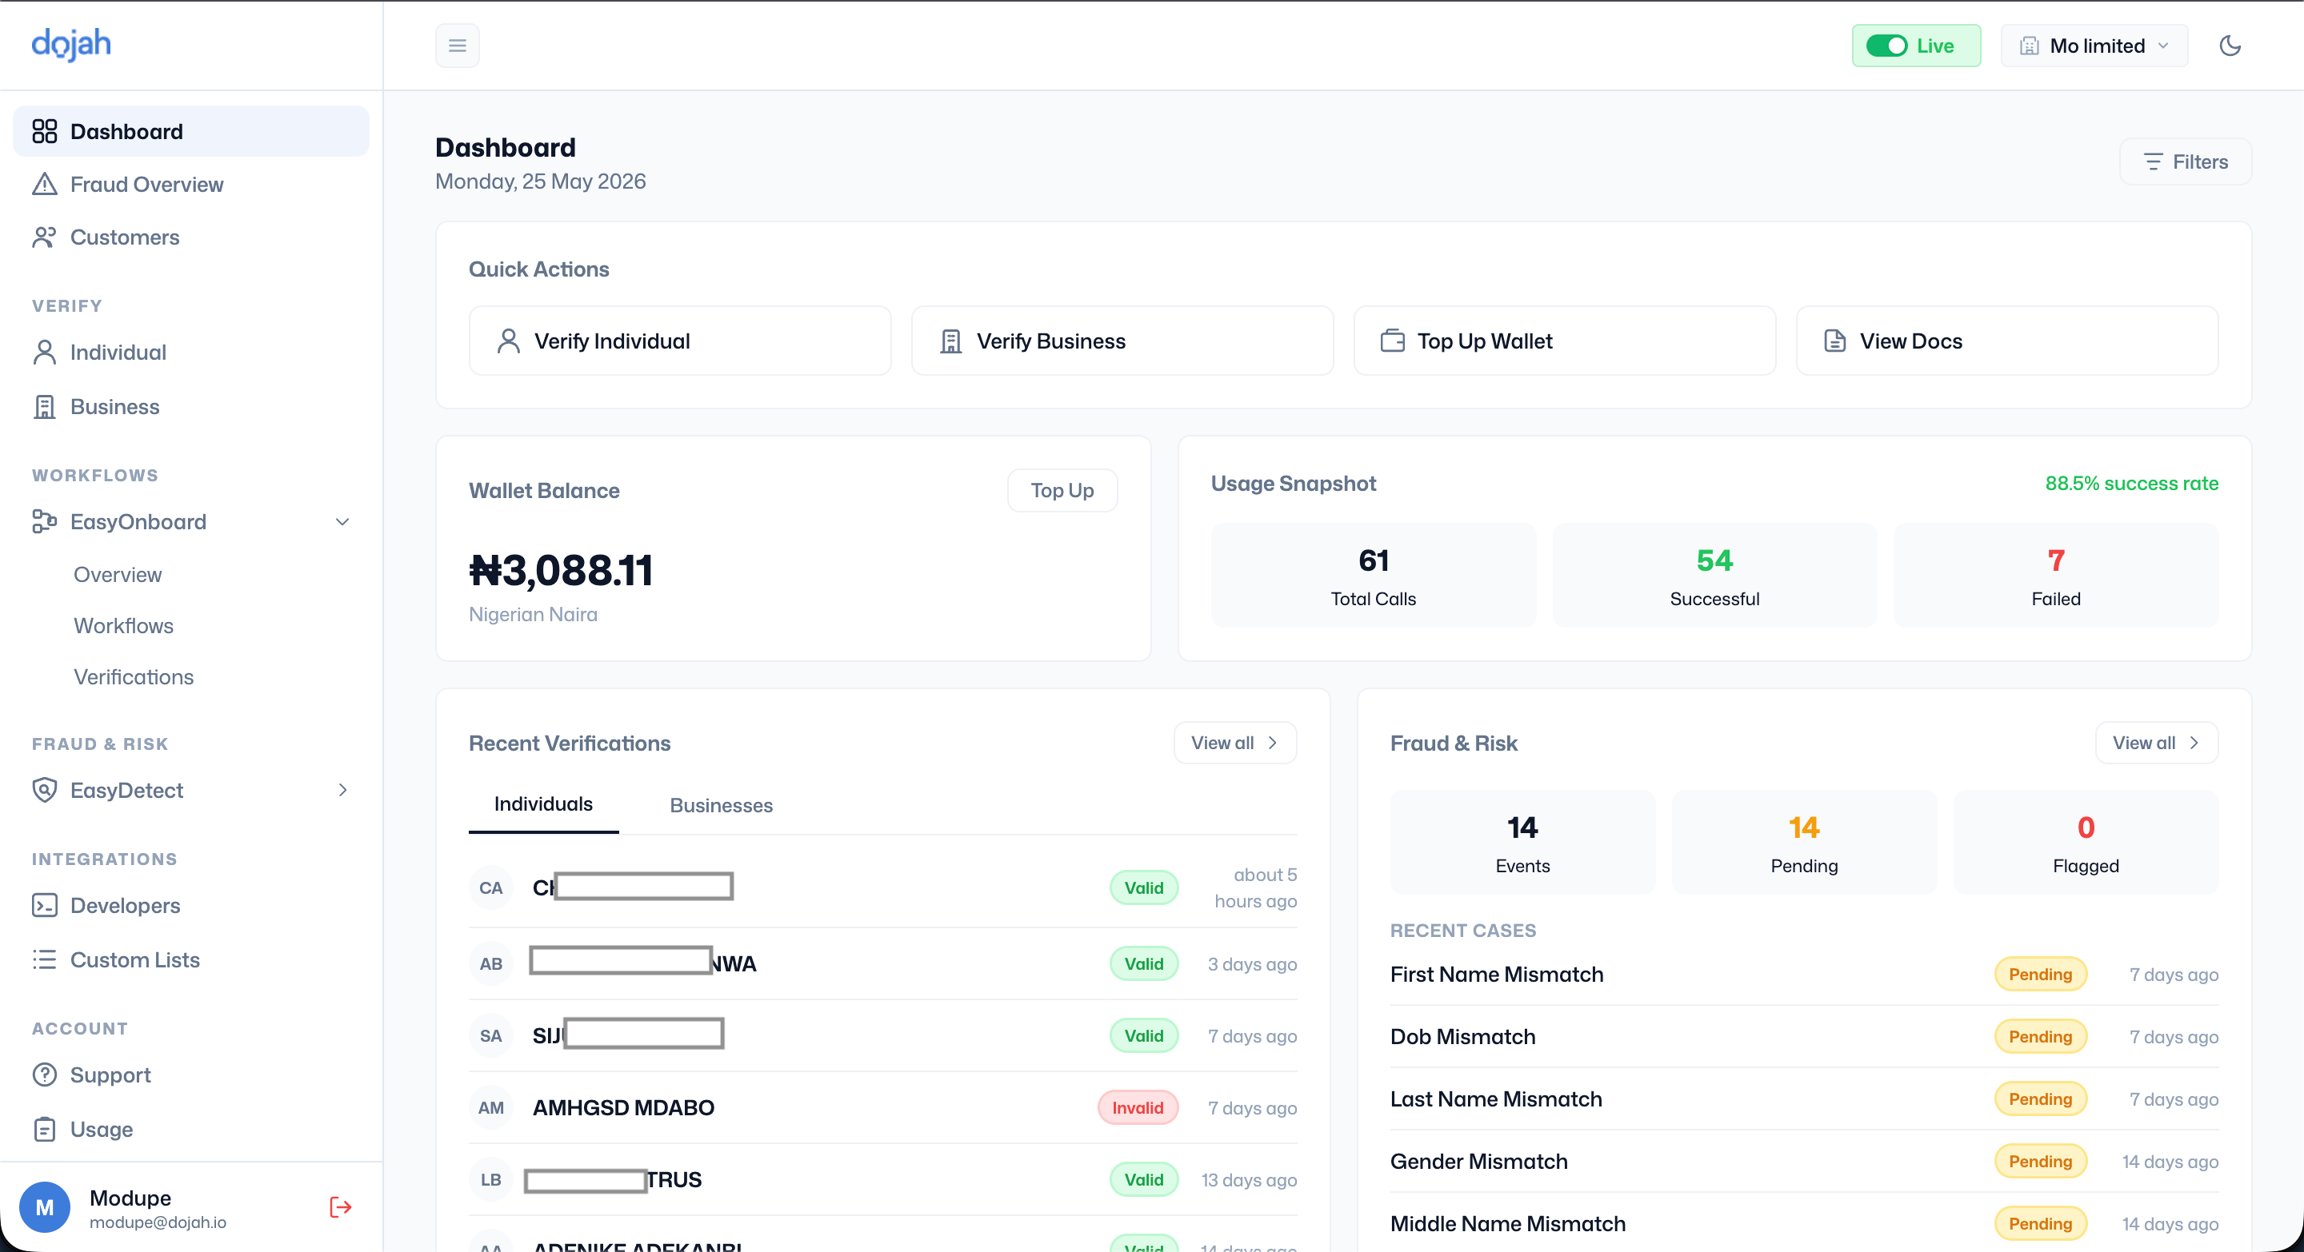
| Top bar | Environment toggle, workspace selector, and dark mode switch |
|---|---|
| Left sidebar | Navigation menu for all features and account settings |
| Main content area | The primary workspace showing dashboard cards and data |
| Right panel | Fraud & Risk event feed from EasyDetect |
Quick Actions
Four shortcuts sit at the top of the dashboard for the tasks your team is most likely to need in the moment: Verify Individual takes you directly to the New Lookup form for individual verification, pre-set to Government Lookup. Use this when you need to run a one-off identity check on a person without navigating through the sidebar. Verify Business takes you to the business verification New Lookup form. Use this to quickly run a CAC check on a company without going through the Business section. Top Up Wallet opens the wallet top-up modal directly. If you receive a low-balance notification, this is the fastest way to add funds without leaving wherever you are in the dashboard. View Docs opens the Dojah developer documentation in a new tab. Use this when your team needs a quick reference to an API endpoint, webhook setup, or integration guide.
Wallet Balance
Your current wallet balance is displayed in Nigerian Naira or USD on the left side of the dashboard. Every API call on your account, every verification, AML screening, address check, and document analysis, deducts from this balance. The figure shown is live and updates immediately after each transaction. If your balance is lower than expected, check the Usage page for a breakdown of recent API calls and their costs. If you need to add funds, click Top Up next to the balance or use the Quick Action shortcut. See the Billings guide for the full top-up and auto top-up process.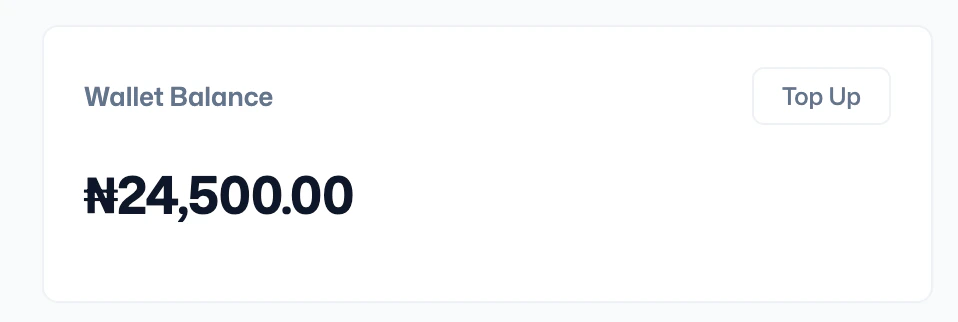
Usage Snapshot
To the right of the wallet balance, the Usage Snapshot shows your API activity for the selected period: ‘Total Calls’ is the headline number, every API request made across all services and applications on your account. Successful is the number of calls that completed and returned a result from the source database. Failed is the number that did not complete, either due to an input error, a record not being found, or a technical issue with the data source. The success rate percentage shown in green gives you an immediate read on the quality of your verification activity. Check the API Status page if you see unexplained failure spikes. Use the Filters button in the top-right corner of the dashboard to adjust the time range for the snapshot or to filter by specific services or environments.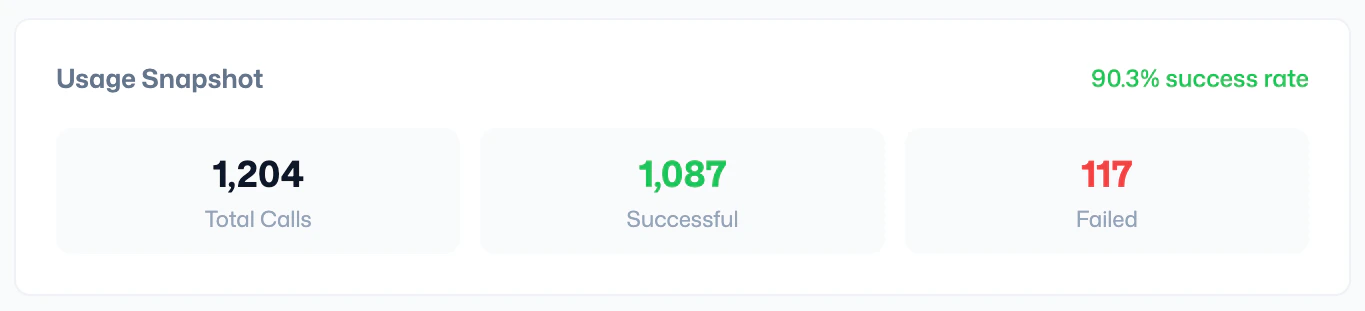
Recent Verifications
The Recent Verifications section shows the latest identity checks run on your account, giving you a live view of onboarding activity without needing to go to the full Customers or Individual Verification pages. Two tabs are available: Individuals and Businesses. Switch between them to see the most recent checks for each type. Each row shows the customer’s name, their verification status, and how long ago the check was completed. The status badges tell you the outcome at a glance. ‘Valid’ means the check passed, the identity was found and the data matched. Other statuses such as Invalid or Not Found indicate the check did not confirm the identity. Clicking any row takes you directly to the full verification record. If you want to see the complete history beyond the most recent entries, click View All to open the full list in the Customers section.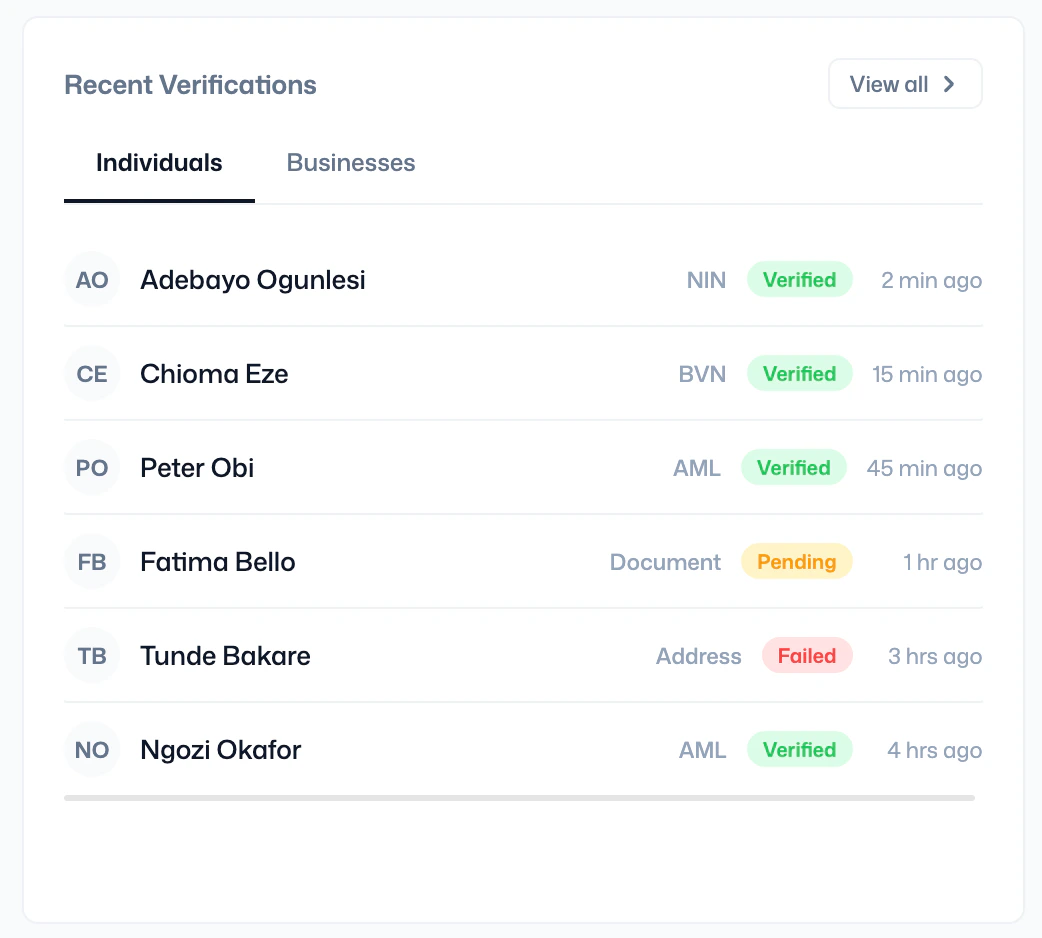
Fraud & Risk Panel
The right side of the dashboard shows the Fraud & Risk panel, powered by EasyDetect. Once your fraud monitoring flows are configured, this panel surfaces real-time alerts for suspicious activity detected across your platform, duplicate identities, blacklisted documents, unusual verification patterns, and more. If the panel shows no fraud events yet, it means EasyDetect has not yet been configured for your account. The panel will remain empty until you create at least one monitoring flow.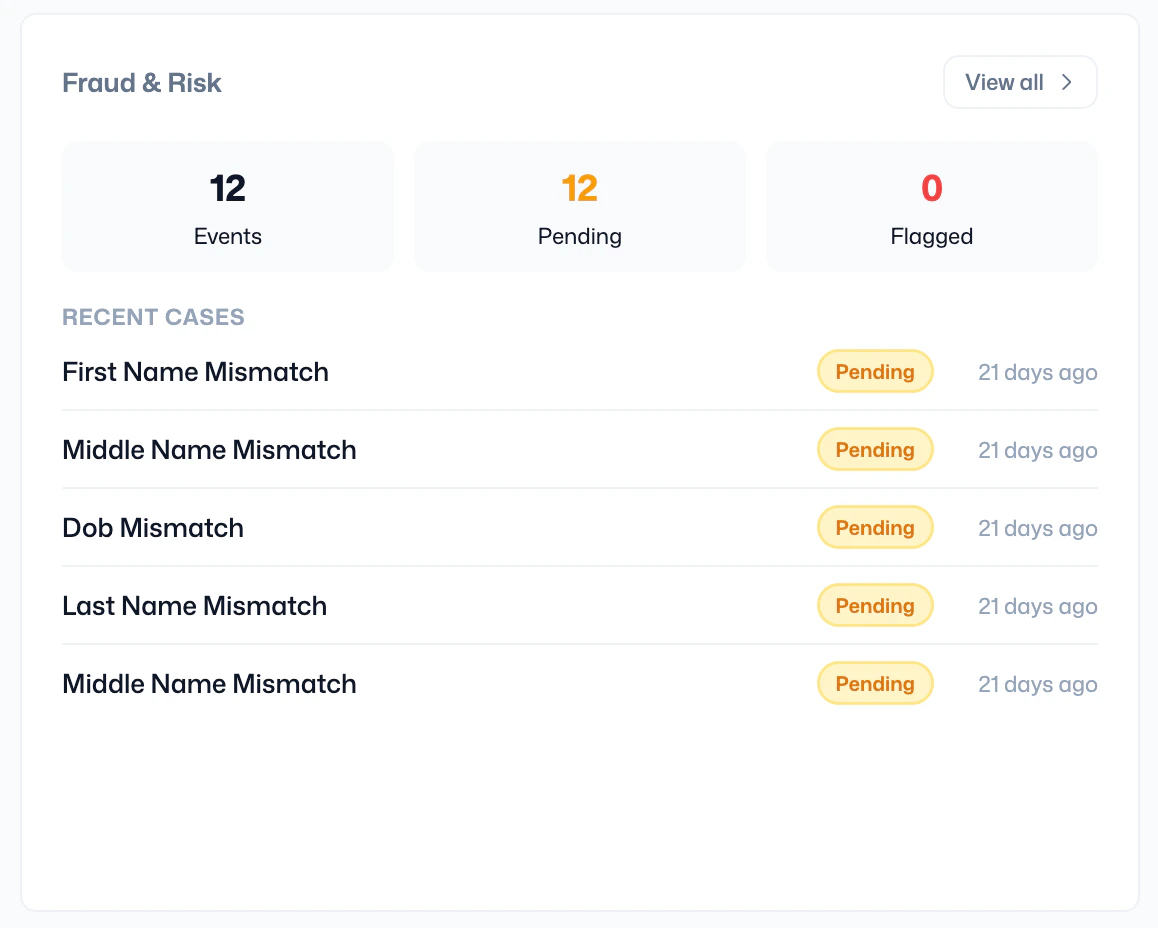
Explore More
At the bottom of the dashboard, the Explore More section provides quick access to Dojah’s four key products with a brief description of each and a Learn More link to the relevant section of the platform: EasyDetect - AI-powered fraud risk scoring and real-time monitoring. EasyOnboard - No-code KYC flow builder for creating customised customer onboarding journeys. EasyAuthentication - Multi-factor authentication for adding quick authentication to your product. AML - Screening customers against global sanctions lists and PEP registries. These are starting points. Each links to the relevant section where you can configure and use the product in full.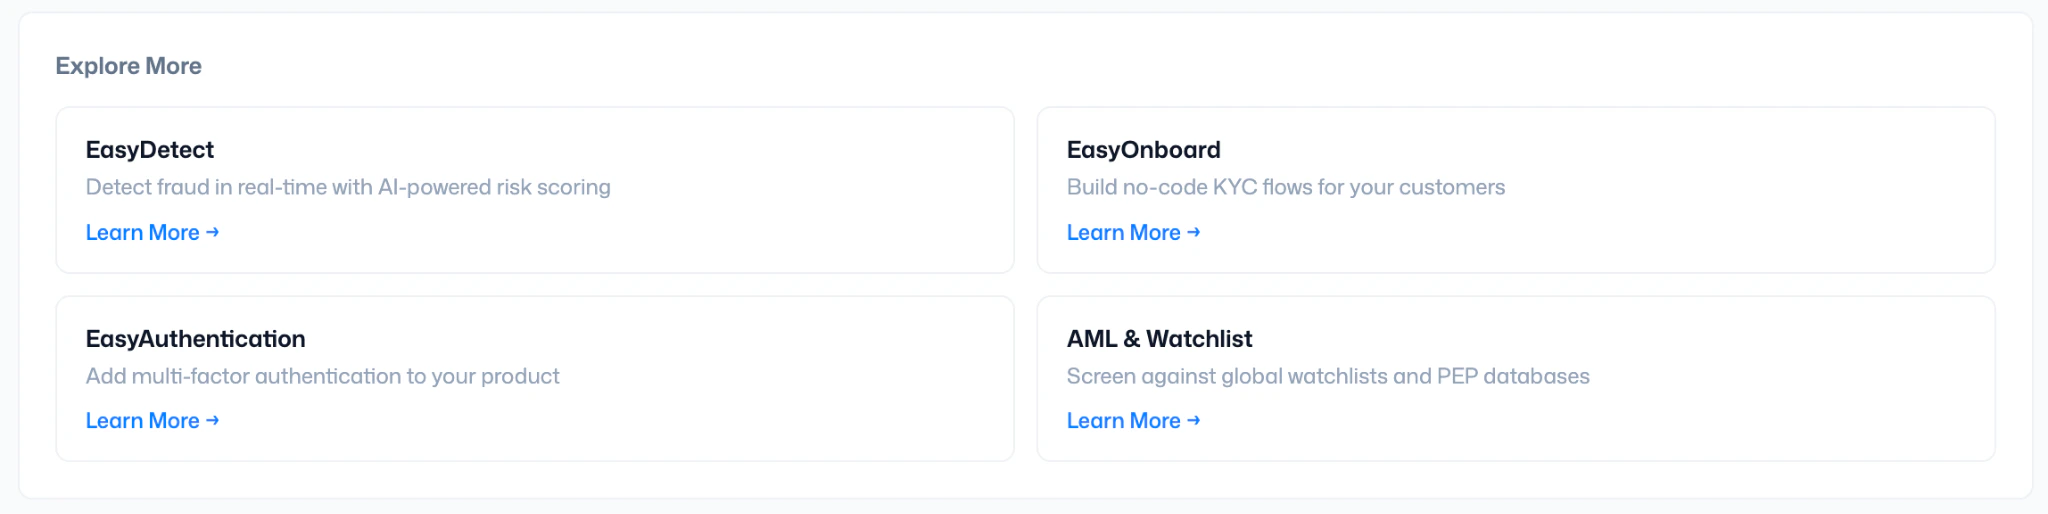
Top Bar
Three controls in the top bar apply across the entire dashboard and every page within it: Live / Sandbox toggle, Switches your account between the Live environment (real data, real cost) and the Test environment (sandbox data, free). The toggle shows green when live is active and amber when it is in sandbox. Always confirm you are in the correct environment before running verifications or interpreting data. Everything shown on the dashboard, verification counts, wallet balance, and fraud events, reflects only the currently active environment. Workspace selector, The dropdown showing your workspace name lets you switch between multiple workspaces if your account has more than one. Each workspace has its own API keys, wallet, and verification history. This is useful for separating live production traffic from staging or managing multiple products under the same Dojah account. To rename or configure your workspace, go to Settings. Dark mode toggle, The moon icon on the far right switches between light and dark mode. Your preference is saved to your account and persists across sessions.