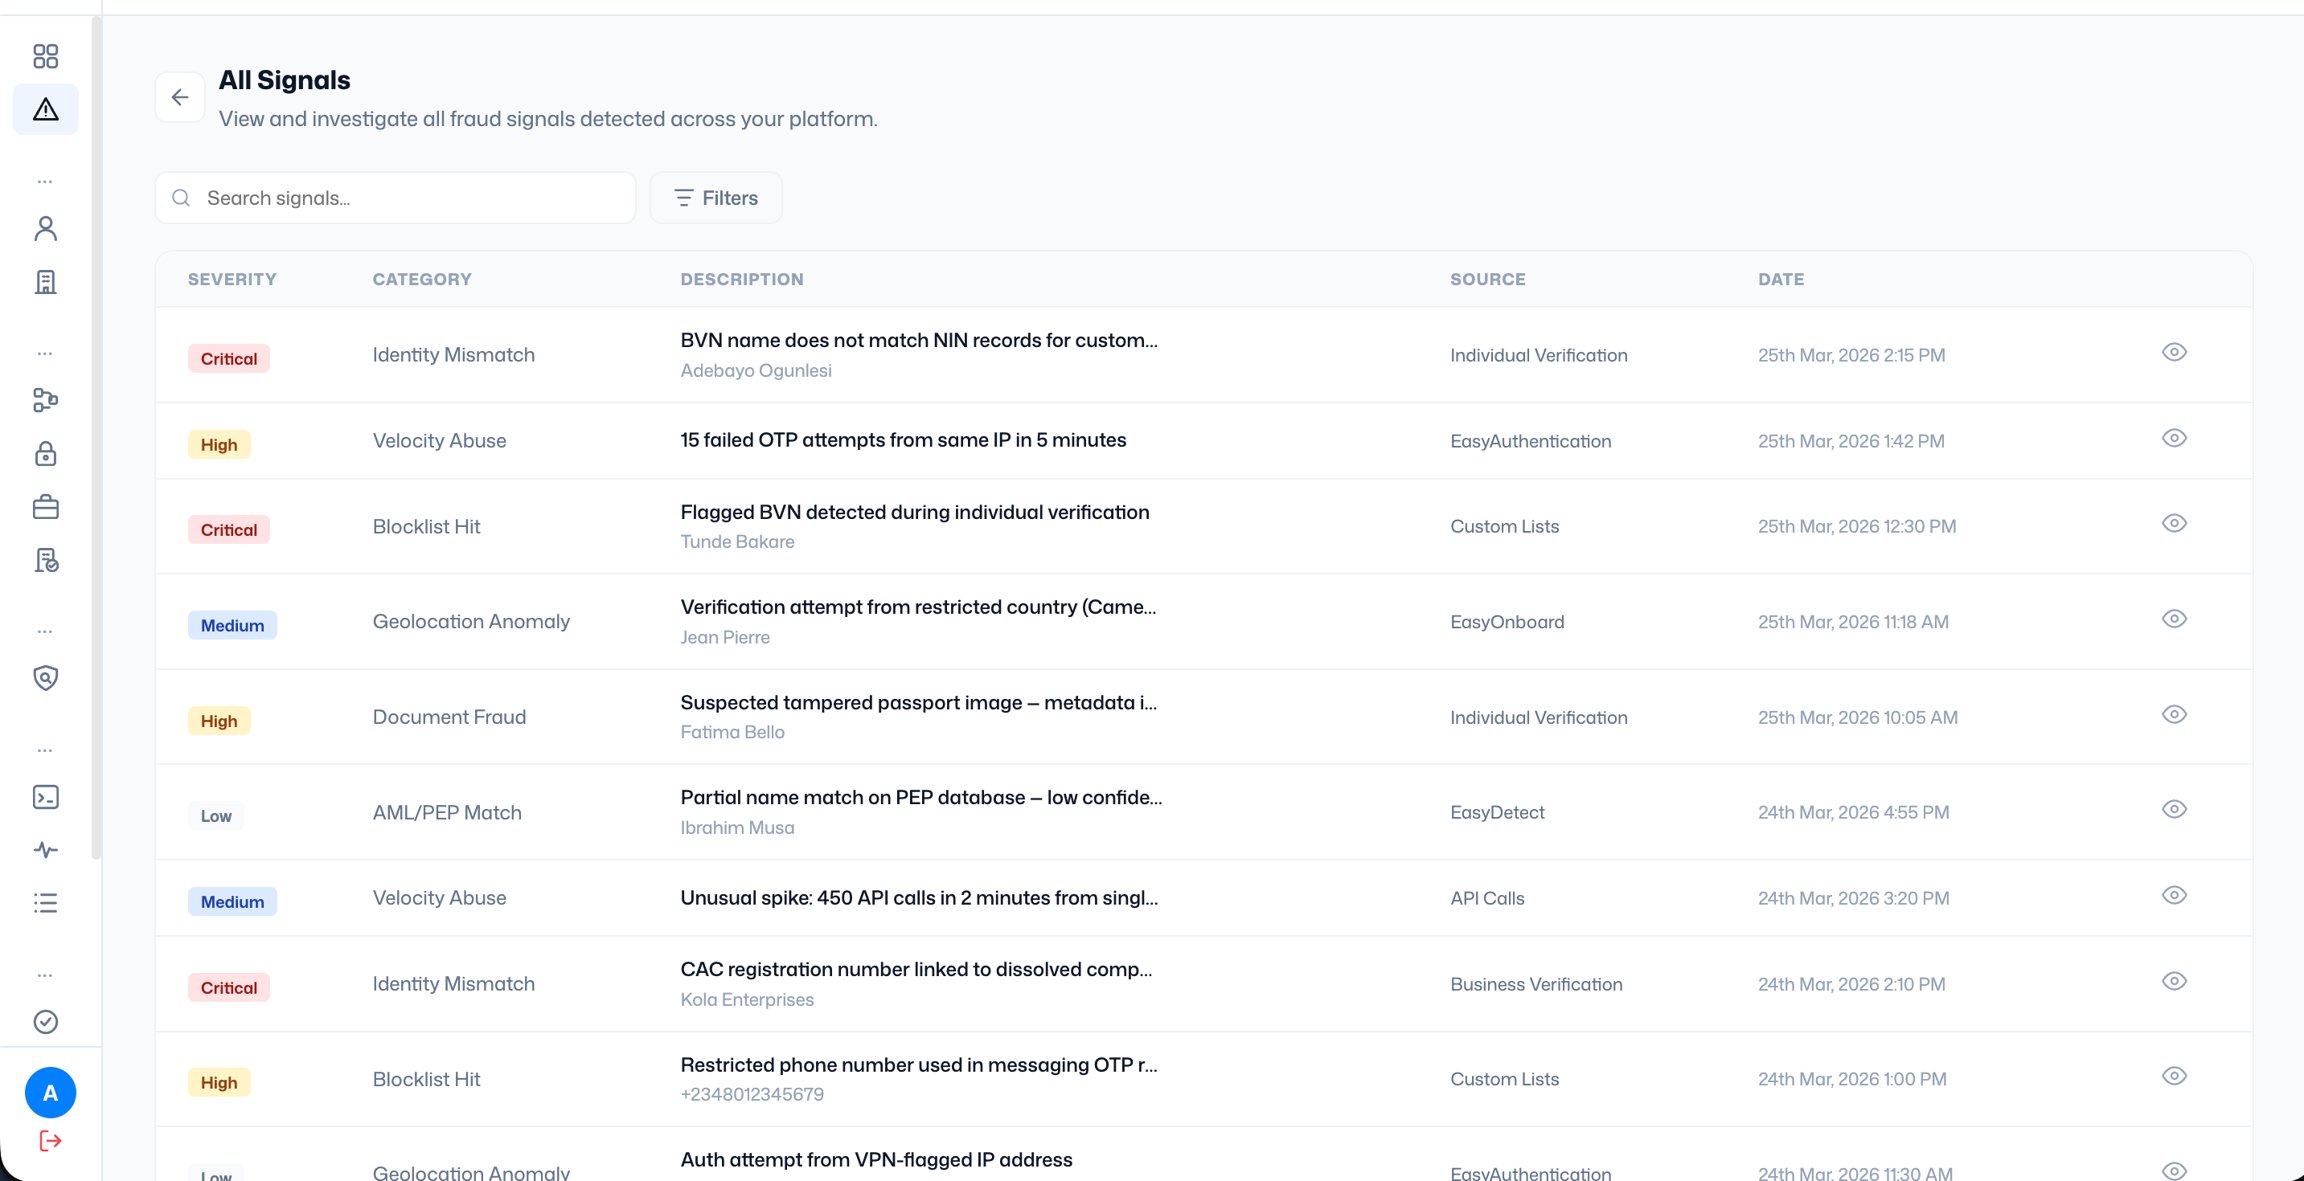
Signal summary cards
Four cards run across the top of the page, each showing a count of fraud signals detected within your selected time period. Total Signals is the headline number: every fraud signal triggered across all severity levels and all sources. Watch this number over time. A sudden spike that does not correspond to an increase in legitimate verification activity is a strong early indicator of an active fraud attempt. Critical signals are the highest-confidence, highest-risk detections. These require immediate review. Examples include a document matching a known fraud blacklist, an AML or PEP match on a new customer, or an identity being used simultaneously from multiple locations. Critical signals should never sit unreviewed; unresolved ones may mean active fraud is occurring on your platform right now. High signals indicate strong suspicious patterns that are likely but not definitively fraudulent. They require attention within the same business day. Common examples include identity data mismatches where a submitted name does not match the government record, or velocity abuse where the same identity is being verified repeatedly in a short window. Medium signals represent patterns that warrant investigation but may have legitimate explanations. A phone number on a blocklist, a document type mismatch, or slightly elevated verification frequency from one user would all generate Medium signals. Low signals are tracked in the Signal Trend chart and accessible in the full signal list but do not have a dedicated summary card. They are logged for awareness and pattern monitoring rather than immediate action.
Signal Trend chart
The Signal Trend chart shows the daily volume of fraud signals broken down by severity over your selected date range. Each bar represents one day, divided into colour-coded segments: red for critical, orange/amber for high, blue for medium, and light grey for low. Use this chart to identify patterns rather than just totals. A single-day spike, particularly one dominated by red, suggests a coordinated fraud attempt or a burst of bot activity. A gradual increase across several days suggests a growing vulnerability being slowly exploited. A high proportion of red segments concentrated in a short window means your most urgent signals are clustered and need immediate investigation. To change the time window, use the date range filter in the top-right of the page. The default is the last 7 days. You can also select the last 30 days, the last 90 days, or a custom date range. Changing the date range updates all cards, charts, and panels on the page simultaneously.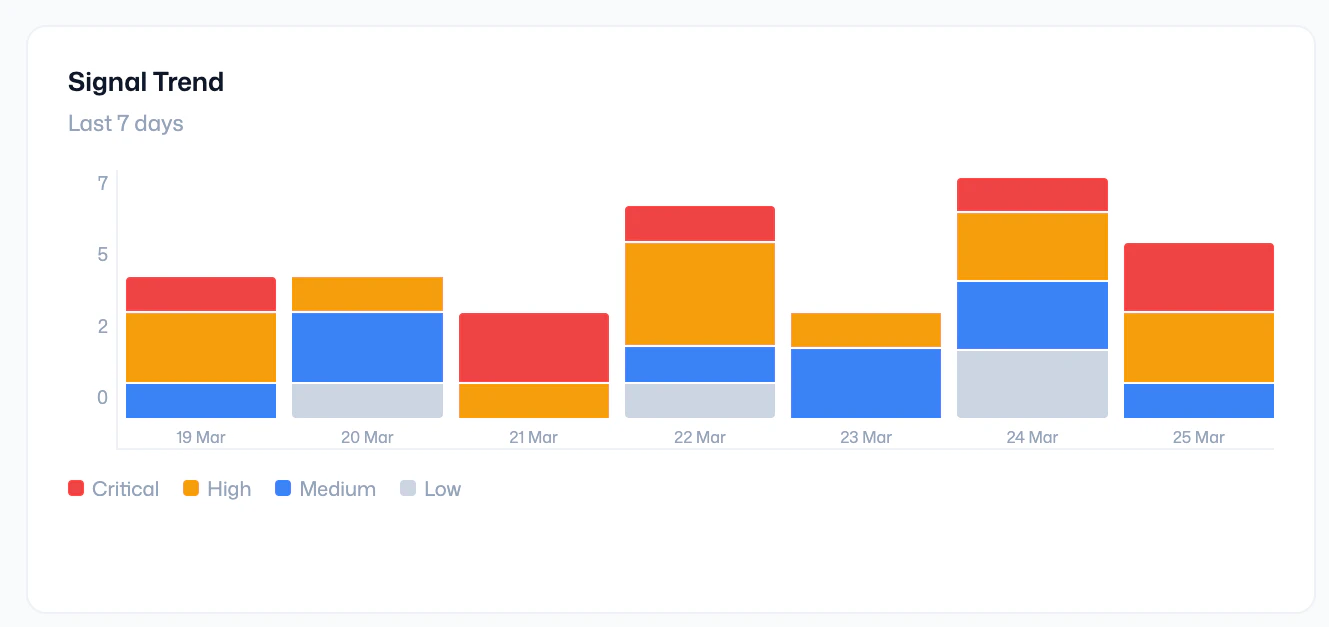
By Category panel
The By Category panel shows how your signals are distributed across different fraud types. Each category has a coloured bar indicating its relative volume and a total count on the right. ‘Identity Mismatch’ is the most common category across most platforms. It means the submitted identity data, name, date of birth, and address did not match the record returned by the source database. A high count here often indicates deliberate falsification of personal details during onboarding. ‘Velocity abuse’ means the same identity, device, or phone number is being used to make an unusually high number of verification requests in a short period. This points to bot activity, credential stuffing, or mass account creation attempts. ‘Blocklist Hit’ means a submitted identifier, BVN, phone number, email, or document number matched an entry on one of your custom lists configured as a blocklist. ‘Document fraud’ means the submitted identity document appears suspicious, possibly forged, tampered with, expired, or previously flagged in a fraud database. ‘Geolocation anomaly’ means the user’s detected location is inconsistent with their registered address, or they are accessing your platform from a high-risk region. ‘AML/PEP match’ means the user’s name or identity matched against an anti-money laundering watchlist or a politically exposed persons registry. Any AML/PEP match requires mandatory escalation to your compliance team before proceeding with that customer, regardless of the signal count. The category breakdown helps you understand the nature of fraud on your platform, not just its volume. A high identity mismatch count may suggest your onboarding flow needs stricter input validation. High velocity abuse numbers point to a need for rate limiting. Multiple blocklist hits may mean your custom lists need expanding. Use this panel to guide where you invest in fraud prevention improvements.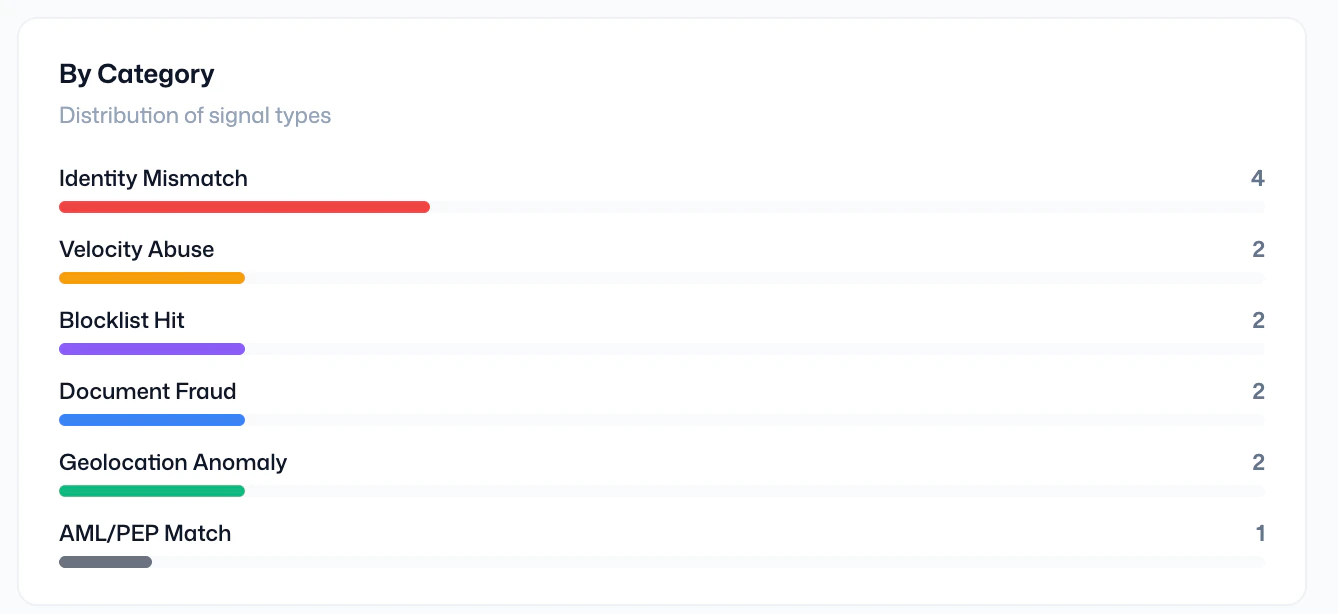
By Source panel
The By Source panel shows which Dojah products generated the fraud signals as a donut chart with counts and percentages for each source. Individual verification generating a high share is expected for platforms with active KYC onboarding, but a disproportionately large share may suggest that verification inputs are of poor quality or that your onboarding flow is attracting a high volume of fraudulent submissions. EasyAuthentication signals could indicate account takeover attempts. Custom Lists signals mean identifiers submitted by your users are hitting your blocklists, your lists are working as intended, but a growing share here may mean you need to review and expand them. EasyOnboard signals come from your KYC flows, the point where most fraud attempts typically occur. EasyDetect signals are generated directly by your fraud monitoring rules; these are the most intentional detections, triggered because your configured rules identified a pattern worth flagging. API Calls: If direct API calls are generating a disproportionate share of signals, investigate whether your API keys may have been exposed or are being misused. Rotate your keys via the Developers section immediately if this is suspected.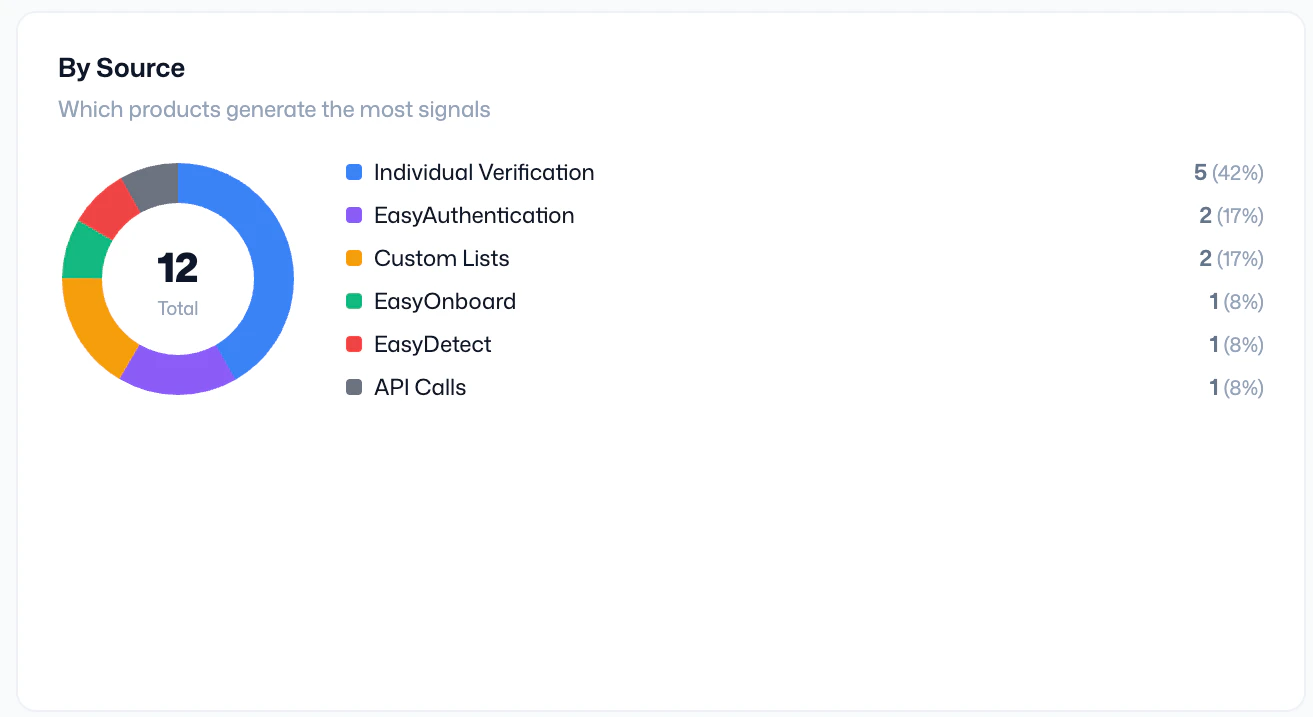
Top Flagged Users panel
The Top Flagged Users panel lists the individuals on your platform with the most fraud signals in the selected period. Each row shows the user’s name, when they were last seen, and their total signal count. A user appearing at the top of this list does not automatically mean they are a fraudster. It means they have generated more suspicious signals than others and need closer inspection. A signal count of 3 or more, particularly of critical or high severity, is the threshold at which most compliance teams move to manual review and consider temporarily restricting the user from completing high-value actions. When reviewing a flagged user, open their full customer profile to see all signals in detail, check their verification history, assess whether the signals are explainable by legitimate circumstances, and document your decision. Do not dismiss flags without investigation; even if a user turns out to be legitimate, the review and its outcome should be recorded.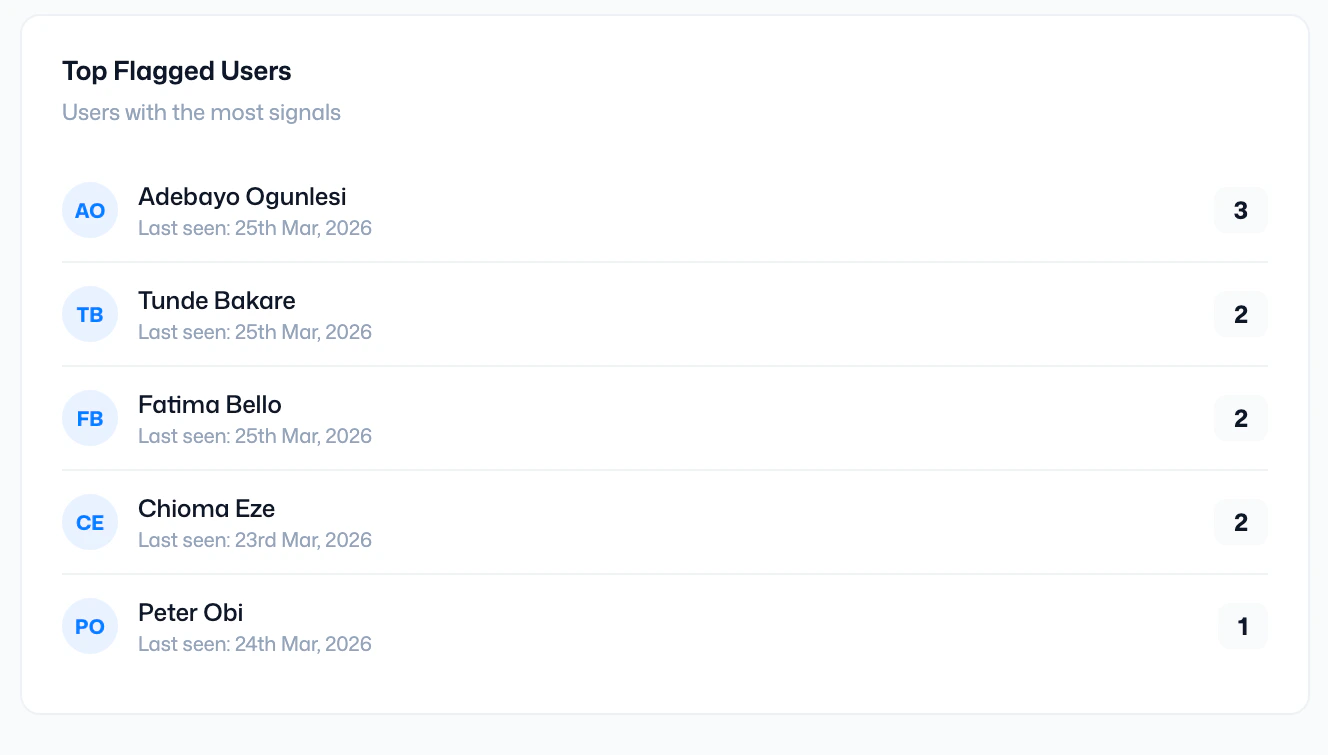
View Signals
The ‘View Signals’ button in the top-right of the page opens the full signal log, a complete, filterable table of every fraud signal triggered on your account. Each signal in the list shows its ID, the associated user, the category, severity, source, timestamp, and whether it is open, under review, or resolved. Use the filter controls to narrow the list by date range, severity, category, source, status, or a specific user’s name or ID. To export signals for compliance reporting, audit submissions, or offline analysis, apply your filters first and then click Export. The export downloads as a CSV file containing all visible columns. For regulatory reporting on AML/PEP matches, filter by the AML/PEP Match category and export alongside the corresponding customer verification records from the Customers section.