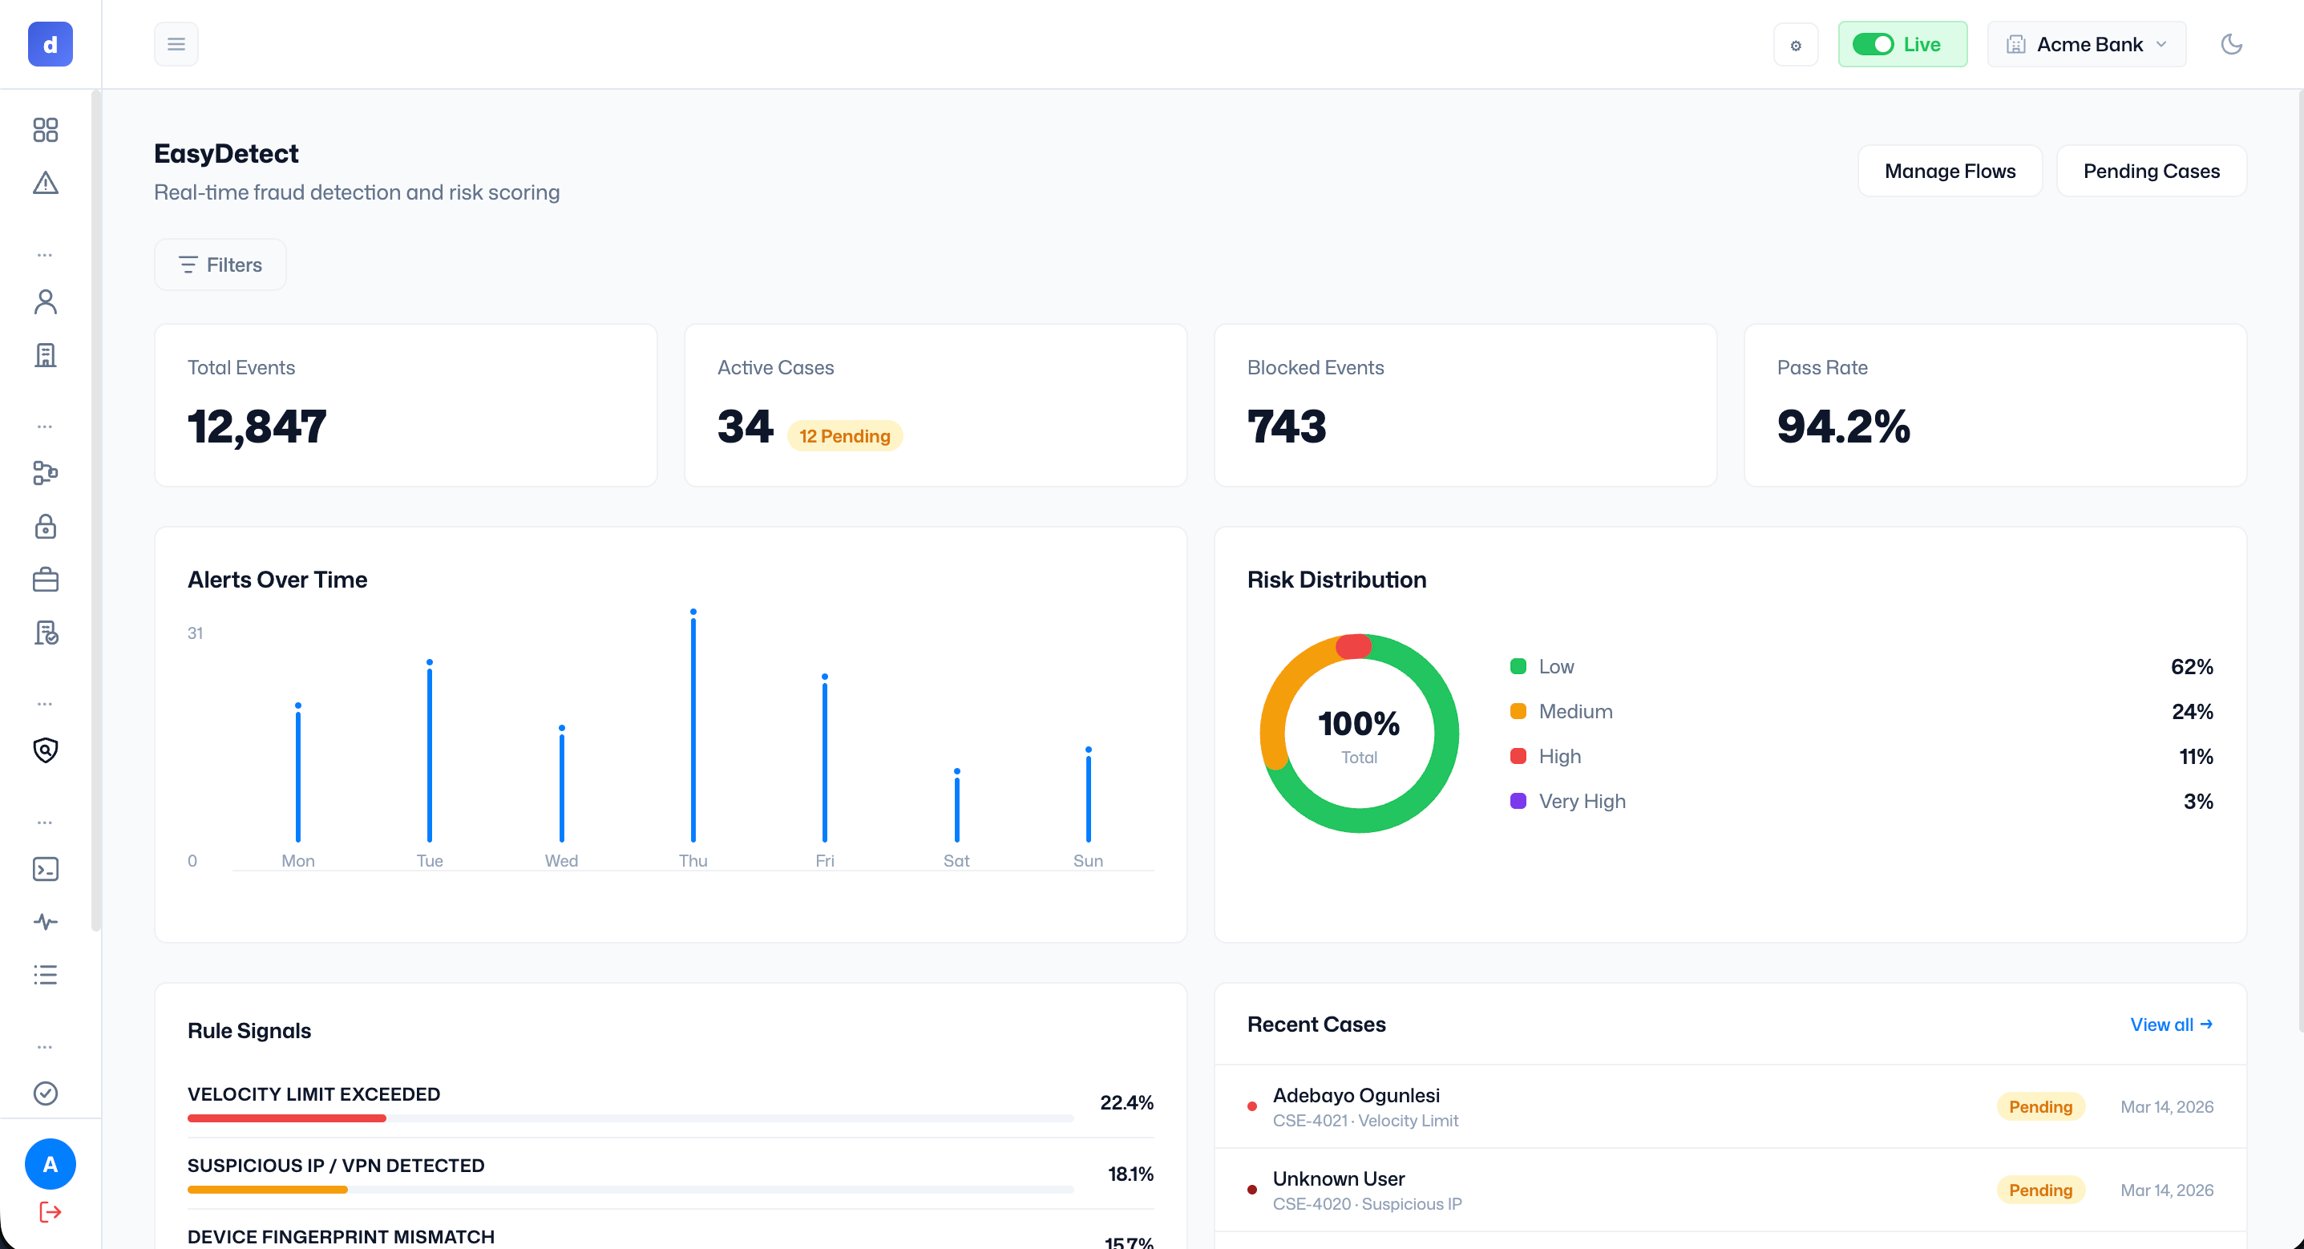
- Total Events: the total number of events processed across all flows.
- Active Cases: open cases, with a count of how many are pending review.
- Blocked Events: events that were automatically blocked by your rules.
- Pass Rate: the percentage of events that passed without being flagged or blocked.
Risk tiers Risk scores range from 0 to 100. They map to four tiers:
- Low: score roughly 0-40. Typically allowed automatically.
- Medium: score roughly 41-65. May require review depending on your rules.
- High: score roughly 66-85. Likely flagged or blocked.
- Very High: score roughly 86-100. Highest risk, usually blocked.