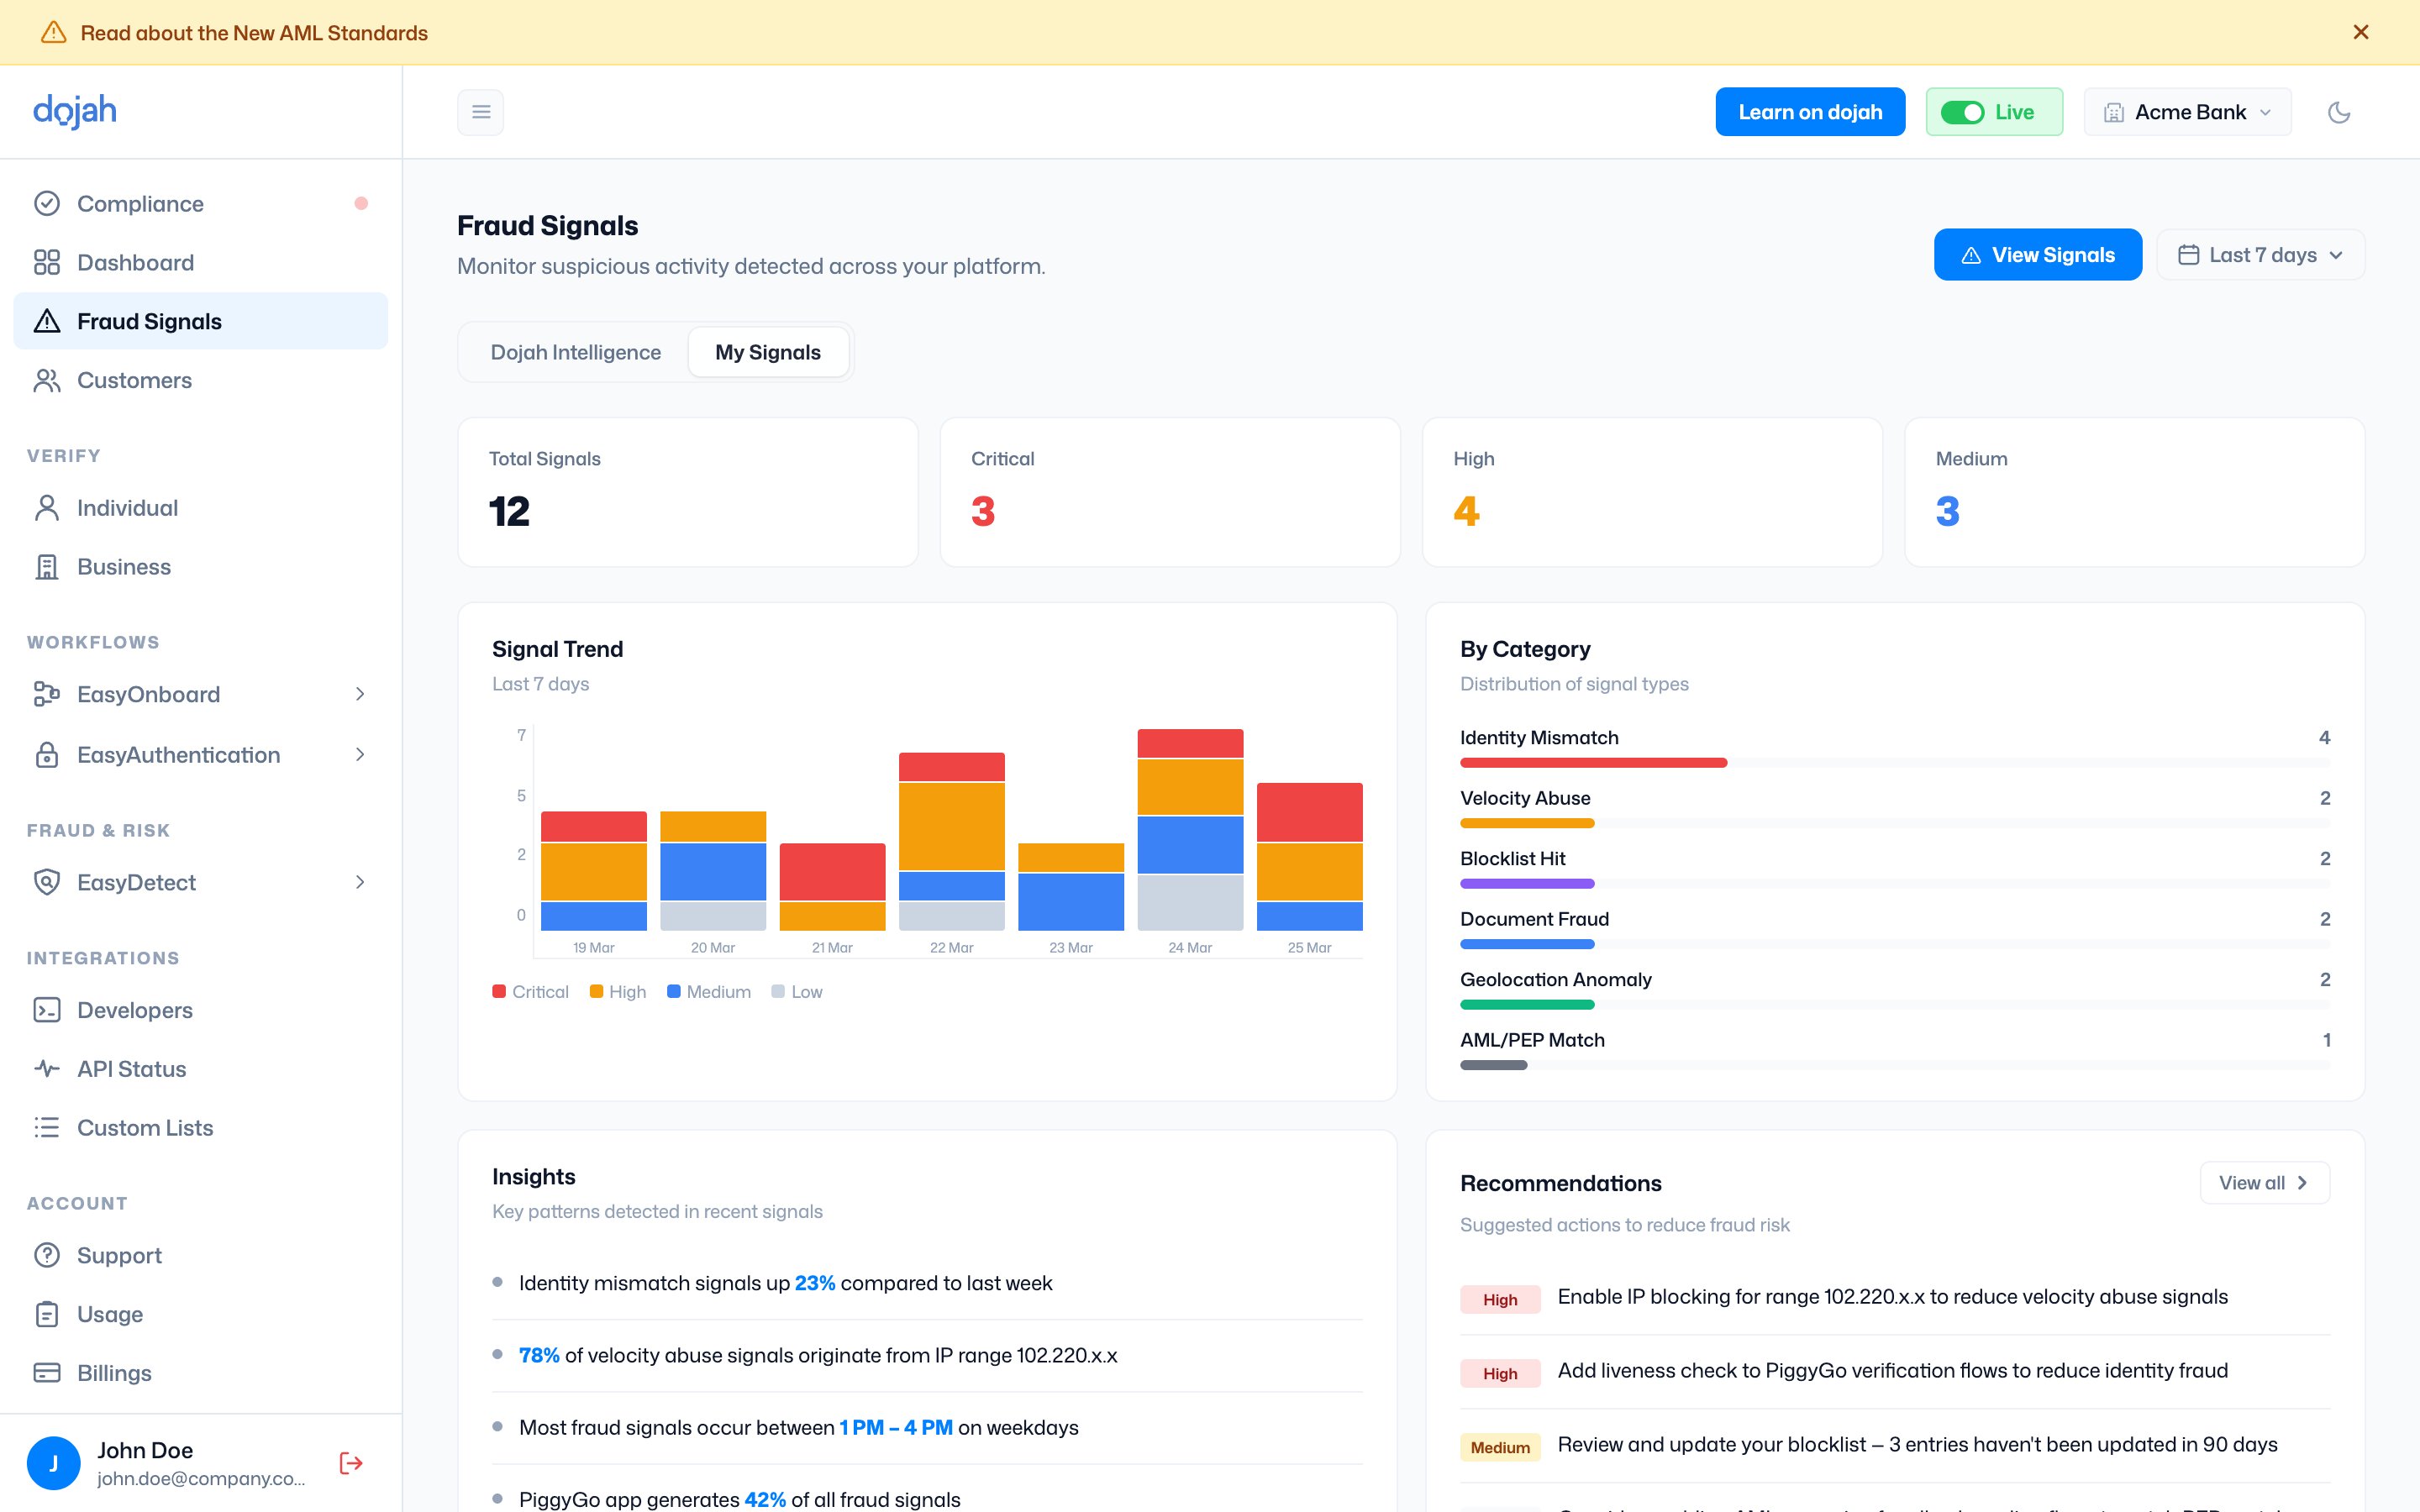
The signals raised by your own verifications and workflows, over the period you choose. The My Signals view

At a glance

Headline counts — Total Signals, Critical, High, and Medium — sit above a Signal Trend chart (signals over time by severity) and a By Category breakdown (Identity Mismatch, Velocity Abuse, Blocklist Hit, Document Fraud, Geolocation Anomaly, AML/PEP Match).

Insights & Recommendations

Insights call out patterns in your data (for example, identity mismatches up week-on-week, a noisy IP range, peak hours, or a high-signal app). Recommendations suggest actions to reduce risk — enable IP blocking, add a liveness check, or update your blocklist — each tagged by severity.

All signals

View Signals opens the full list, where you can search and filter by Severity, Category, and Source (Individual & Business Verification, EasyAuthentication, EasyOnboard, EasyDetect, and Custom Lists).